

Why Your Multi-GPU Training Job Keeps Dying
Four ways a small multi-GPU run kills itself, and the logging that tells you which one it was

Multi-GPU training jobs die four ways. (1) One GPU misses a sync and the rest wait ten minutes, then the job dies. (2) One slow GPU throttles the rest. (3) Memory runs out on one GPU while the others have room. (4) A crash lands you on a checkpoint that cannot resume. Telling them apart is a logging problem you solve before the run starts.
🧭 Part 12 of the ⚡ Hardware & Inference course
TL;DR
Every GPU waits for the slowest one. Each training step ends with the GPUs summing their results together, and that sum completes only after all of them have arrived. So the slowest card sets the pace, and a missing card stops the run.
The GPU that reports the timeout is rarely the one that caused it. PyTorch gives the processes 10 minutes to sync before it kills one, and the one it kills is the one that showed up and waited.
Meta tells you the scale. 419 unexpected interruptions in 54 days on 16,384 H100 GPUs, about one every three hours. At four GPUs almost none of their recovery machinery earns its keep.
A checkpoint has to hold the whole run. Optimizer state, the learning-rate schedule, the data loader position, and the random-number state all ride along, or your resume is a restart.
Instrumentation is the fix, and it goes in first. Every N steps, log each GPU’s wait time, its peak memory, and the step of your last good checkpoint. Those three numbers name which of the first three you hit. Add them after the hang and they tell you nothing.
What Breaks the Moment You Add a Second GPU
Hour six of an eight-hour fine-tuning run on four GPUs. The job is four processes, one per card, and each process is a rank, numbered 0 to 3. Rank 2 prints Watchdog caught collective operation timeout. Torchrun, the launcher that started the four processes, kills all of them, and the scheduler restarts the job from your last checkpoint. That checkpoint landed at hour four and holds model weights only, so the optimizer state is gone and the data loader begins again at the first file of your dataset. You paid for six hours of compute and kept four.
A single-GPU job has two states, finished and crashed, and you can read both. A multi-GPU job has two more. The third is every process alive, every card busy, and nothing moving. The fourth is quieter still: the job restarts, runs perfectly, and is four hours behind where you left it.
Those two exist because the run above has four cards, and four processes that have to agree, several times per training step, on the summed gradients. No single one of them can compute that sum alone.
That agreement travels through a collective operation, a synchronized call where every process contributes data and every process gets the combined result back. The most common setup splits each batch across the cards and has every rank train on its own slice. That is data-parallel training, and its core operation is the all-reduce: each rank computes gradients on its slice, the all-reduce sums them across ranks, and every rank comes out holding the identical total. NVIDIA’s NCCL library moves the bytes and PyTorch calls into it for you.
Every collective operation is a barrier. The all-reduce returns to a rank only after all four have arrived, so nobody runs ahead and nobody drifts. Four ranks move like climbers roped together: they advance at the pace of the slowest one, and when one goes off the edge the rope takes the rest.
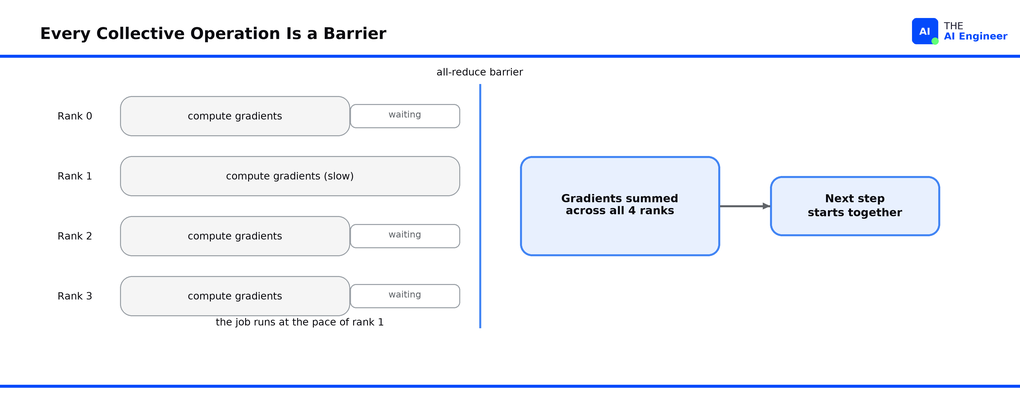
The same rope holds at four thousand times the scale. Meta trained Llama 3 405B on up to 16,384 H100s. Over 54 days that job stopped unexpectedly 419 times, about one every three hours for two months. It still spent over 90% of its wall-clock time training1.
Your four-GPU job does not fail every three hours. It fails rarely enough that nobody instrumented it, which is why one failure costs a day of debugging where it should cost a minute of reading a log.
Here are the four failures, one at a time. Each section runs the same way: the symptom, the mechanism underneath, the fix, and where that fix still breaks.
1. The Job Hangs, and You Debug the Wrong GPU
What you see: the loss stops printing. You check nvidia-smi. Every card is working flat out.
You have stared at that screen before and concluded the job was fine. It was not. A rank stuck waiting on a sync runs a small GPU program that loops until the bytes arrive, and they never do, so the card reads busy while nothing moves. Ten minutes later exactly one rank raises Watchdog caught collective operation timeout: WorkNCCL(SeqNum=..., OpType=ALLREDUCE, ..., Timeout(ms)=600000) and takes the whole group down with it.
What is happening: when the four processes start, they register with each other as one group. PyTorch puts a clock on that group, and when NVIDIA’s NCCL is the library moving the bytes, the default is 10 minutes. A watchdog thread checks whether each collective completed inside that window. When one has not, it shuts down that rank’s NCCL communicator, the handle it uses to reach the other three, and crashes the process2.
The rank that raises the error is the one that arrived on time and waited. The rank that caused it prints nothing, because from where it sits nothing has gone wrong. PyTorch’s own engineers say the first rank to raise a watchdog timeout is rarely the culprit3.
Three causes cover most small-cluster hangs.
A rank stalled on the CPU side. Its data loader is waiting on a slow network drive, or one of its worker processes has deadlocked, so that rank never scheduled its side of the collective.
The ranks diverged in Python. Rank 0 took a branch the others skipped, so they now wait on two different collectives that will never match.
The GPU never picked the work up. PyTorch queued the all-reduce onto the card and the card never began it.
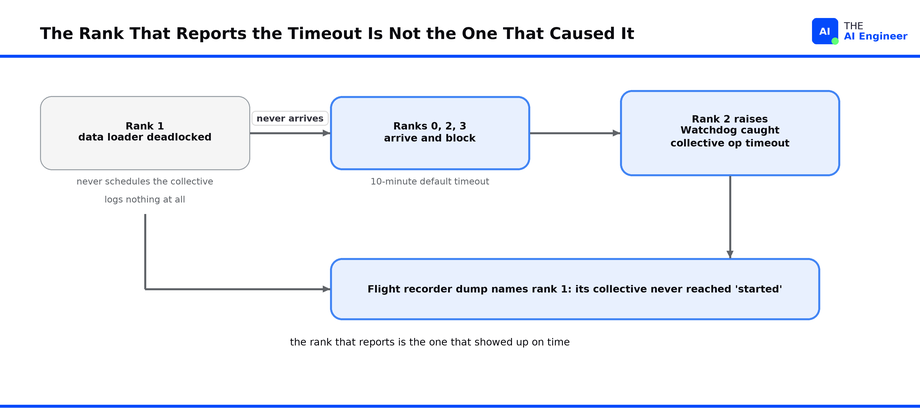
The fix: have PyTorch keep a running log of the last few thousand syncs on every rank. That is the flight recorder. TORCH_NCCL_TRACE_BUFFER_SIZE=2000 sets it to 2,000 entries per rank, which covers several minutes of a healthy run. Once the job hangs nothing new gets added, so the sync that never finished is still sitting there when the watchdog fires ten minutes later. Each entry carries the collective’s type, its tensor sizes, and how far it got: scheduled, started, or completed. TORCH_NCCL_DUMP_ON_TIMEOUT=1 writes the buffer to disk when that happens. Then run torchfrtrace, the reader that ships with PyTorch, over the dump directory. It lines the four ranks up against each other and names the one whose collective never got past scheduled4.
The reflex is to raise the timeout. Raise it only once you know what the job is waiting for. On a real deadlock a longer timeout buys a longer hang and nothing else.
Where it still breaks: the recorder only sees collectives. A rank stalled in Python before it schedules anything leaves a gap where an entry should be, so you can name the rank by elimination and still not know what it was doing. TORCH_NCCL_TRACE_CPP_STACK=1 adds call stacks for the collectives that did get scheduled, which helps on a mismatch and does nothing for a Python stall. A rank whose host process died outright leaves no dump at all. That absence is the diagnosis.
2. One Slow GPU, and You Pay for Four to Get Three
What you see: no crash, no error, no stack trace. Your steps take half again as long, and stay there. All four ranks report almost the same step time and all four read busy, and your eight-hour run is now a twelve-hour run.
What is happening: the same barrier, with nothing crashing. One degraded GPU arrives late at every all-reduce, and the other three absorb the delay as waiting, so the whole job takes that card’s pace. The Llama 3 team calls the slow-GPU failure one of the hardest to catch, because the straggling GPU keeps answering. Its communications still complete, only late, so no watchdog fires and no error appears anywhere.
Three things cause this at small scale. A card with poor airflow throttles itself when it gets hot. And every card talks to the rest of the machine over a fixed number of data lanes, an interface called PCIe. A card wired into fewer of those lanes gets fed more slowly, so it starves. The third looks like hardware and is software: uneven work per rank. Rank 0 is the coordinator by convention, so it writes the checkpoints, prints your loss, and handles logging. Every one of those chores is time the other three spend at the barrier.
The fix: all four ranks report almost the same step time, because the barrier forces them to. So comparing step times tells you nothing. Split the measurement instead: time each rank’s compute separately from the time it spends waiting on a sync. Set TORCH_NCCL_ENABLE_TIMING=1, which timestamps every sync on the GPU itself, so you get the two numbers apart. Then read it backwards: a long time inside collectives marks a rank that waited, and the rank with the shortest wait is the one everybody waited for. Point nvidia-smi at that card for clock speed, temperature, and power draw5.
Where it still breaks: when uneven batch sizes cause the lag, the slow rank changes from step to step, so an epoch average flattens it into nothing. Use per-step numbers, and since timing every collective costs CPU overhead, leave it on through a shakedown run only. No card errors here. Nothing crashes. You just pay for four and get three.
3. One GPU Runs Out of Memory, the Others Have Room
What you see: CUDA out of memory on rank 3 at step 4,812, after 4,811 steps that ran fine. The other three then hang for ten minutes, and one of them reports the timeout. The failure you just learned to read is now the symptom of a different one.
What is happening: memory pressure is per rank, so one process can hit an out-of-memory error with room to spare on its three neighbors. Each rank holds activations sized by the batch it received, and variable-length sequences hand rank 3 a longer batch than the others. PyTorch also never gives memory back to the card between steps; it keeps the blocks and reuses them. Thousands of steps at slightly different sizes leave gaps between those blocks, each gap too small to hold the next thing the job needs to store, and that dead space adds up6.
Rank 0 has its own failure mode here. Some save code gathers the whole model onto rank 0 before writing it out. When the parameters are split across the four cards, that pulls every slice onto one of them, on top of the optimizer state it was already carrying. At two bytes a parameter, a 7B gather is roughly 14 GB on top of everything else, which an 80 GB card absorbs. A 70B gather is 140 GB, which it does not.
The fix: record torch.cuda.max_memory_allocated() for every rank on the same cadence you print loss, so headroom becomes a number you watch. Cap batches by token count instead of by sequence count, which flattens the per-rank spread that variable-length data creates. Set PYTORCH_CUDA_ALLOC_CONF=expandable_segments:True to let PyTorch’s memory allocator grow one segment instead of accumulating slivers. And write saves through torch.distributed.checkpoint, covered in the next section.
Where it still breaks: expandable segments carry an experimental flag in the PyTorch docs, so validate it on your job before you ship it. And none of it helps if the model plus optimizer does not fit at all. At that point it is a smaller model or a bigger card, which is the decision we worked through in What is Quantization?.
4. You Have a Checkpoint, and It Cannot Resume
What you see: the job resumes and the loss jumps. Or the resume looks clean and the curve never returns to where it was, so you spend two days blaming the data.
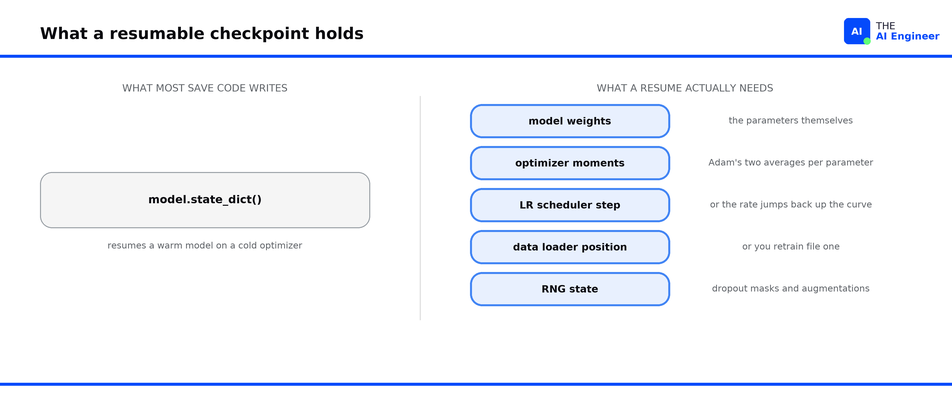
What is happening: most save code writes model.state_dict() and stops there. Resuming a training run needs more than weights. Adam keeps two running averages per parameter, one of the gradient and one of its square. Together they are what let it take a small step in a noisy direction and a large one in a consistent direction. Drop them and the first step after a resume is a cold start on a warm model. The learning-rate schedule needs its step count or your rate jumps back up the curve. The data loader needs its position, or hour six repeats itself. The random-number state decides which dropout masks come next.
Cadence is the second half, and it is arithmetic. PyTorch’s asynchronous distributed checkpointing cut the blocking cost of a 7B checkpoint from 148.8 seconds to 6.3, by copying into CPU memory first and writing to storage on a background thread. At 6 seconds a save, checkpointing every 15 minutes costs you 0.7% of your training time and caps your worst-case loss at 15 minutes of compute. At 148 seconds a save, the same cadence costs 16%, so you stretch the interval to save money and a crash collects the difference7.
The fix: save an application state rather than a model. PyTorch’s distributed checkpoint API takes a dictionary, and each rank writes its own piece of it, its shard, in parallel. Values carrying state_dict() and load_state_dict() methods get called for you; anything else is saved as it is. Two entries have a catch. The data loader has to be torchdata‘s StatefulDataLoader before it can hand back a mid-epoch position. The random-number state has to include the CUDA generator, since that is the one producing your dropout masks8.
import torch.distributed.checkpoint as dcp
from torch.distributed.checkpoint.stateful import Stateful
from torch.distributed.checkpoint.state_dict import get_state_dict, set_state_dict

class AppState(Stateful):
    """Keeps model and optimizer sharded, so no rank holds the whole thing."""
    def __init__(self, model, optimizer):
        self.model, self.optimizer = model, optimizer

    def state_dict(self):
        model_sd, optim_sd = get_state_dict(self.model, self.optimizer)
        return {"model": model_sd, "optim": optim_sd}

    def load_state_dict(self, sd):
        set_state_dict(self.model, self.optimizer,
                       model_state_dict=sd["model"], optim_state_dict=sd["optim"])

state = {
    "app":       AppState(model, optimizer),
    "scheduler": lr_scheduler.state_dict(),
    "loader":    train_loader.state_dict(),        # torchdata StatefulDataLoader
    "rng":       {"cpu":  torch.get_rng_state(),
                  "cuda": torch.cuda.get_rng_state_all()},
    "step":      global_step,
}

if pending is not None:
    pending.result()                               # one save in flight at a time
pending = dcp.async_save(state, checkpoint_id=f"ckpt/step-{global_step}")
Where it still breaks: asynchronous saving buys its speed with host memory. Before writing anything to disk it copies every rank’s shard into CPU RAM, all at once, so the box needs as much free system memory as the whole checkpoint weighs. Print the size of one finished checkpoint directory and compare it against free -g before you turn this on. On a four-GPU box with modest system memory, the thing you added to survive a crash is what causes the next one.
What to Log So the Next Failure Has a Name
Set these before the run starts. Turn one on after the hang and it is worthless: the evidence lived in a buffer that died with the process9.
export TORCH_NCCL_TRACE_BUFFER_SIZE=2000              # ring buffer of recent collectives
export TORCH_NCCL_DUMP_ON_TIMEOUT=1                   # dump it when the watchdog fires
export TORCH_NCCL_DEBUG_INFO_TEMP_FILE=/logs/fr_dump  # one file per rank
export TORCH_NCCL_ENABLE_TIMING=1                     # per-collective durations
export TORCH_NCCL_TRACE_CPP_STACK=1                   # call stacks in the dump
export NCCL_DEBUG=WARN                                # explicit messages on NCCL failure
Then add three numbers to your training loop every N steps, and stamp the rank id and hostname on every log line so a four-rank log stops being four interleaved stories:
Compute time and time inside collectives, per rank. Print all four side by side; the shortest wait names your straggler.
Peak allocated memory, per rank. Reset the counter each time you print, so shrinking headroom shows up as a trend line.
The step number of the last successful checkpoint. Your worst-case loss on any crash, printed in advance.
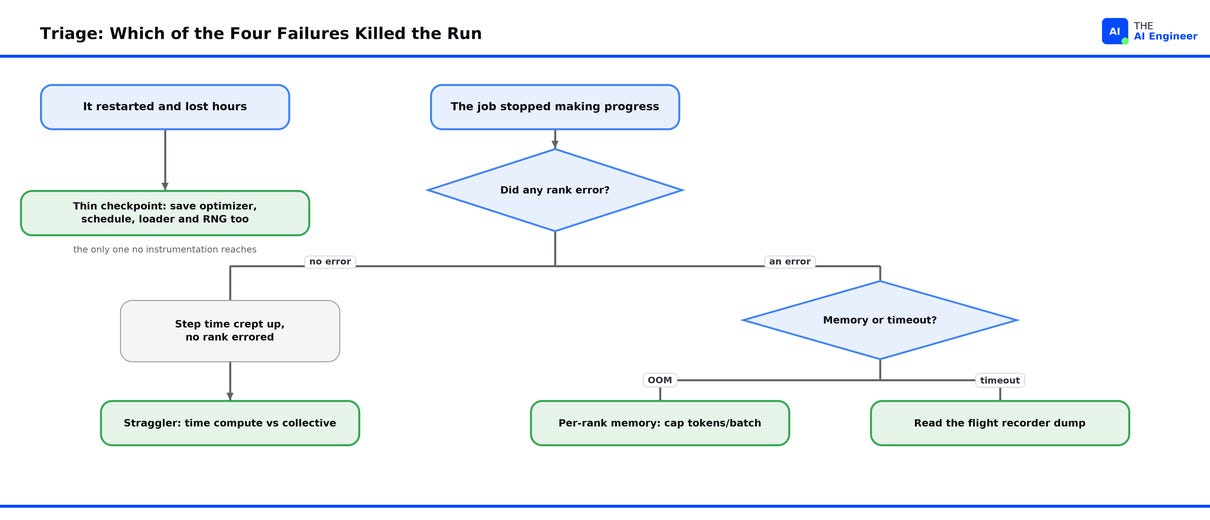
Six variables and three numbers turn a hang, a straggler, and a memory death into a diagnosis you reach in minutes. The fourth failure is the one no instrumentation reaches, because a checkpoint too thin to resume from is a decision you already made before the run started. Logging per-rank numbers instead of job-wide averages is the same argument we made for production serving in What is LLM Observability?.
The Honest Take
One habit transfers from the Llama 3 run. Almost none of the machinery does. At 16,384 GPUs, automated detection and restart is the only way anything finishes; at four, the failure rate is low enough that automation earns nothing. The habit is the cheap half anyway: write down which rank was slow, every step, before you need to know.
The overhyped part is the parallelism vocabulary. Tensor parallelism, which splits one weight matrix across GPUs so each multiplies its own chunk, is load-bearing at frontier scale and irrelevant to a job that breaks at four. Small runs fail on plumbing. A data loader that deadlocks. A rank that runs out of memory on one long sequence. A checkpoint holding half of what a resume needs. No amount of reading about parallelism strategies finds any of those.
One question is worth asking before you debug any of it. Does the job need four GPUs at all? Parameter-efficient fine-tuning freezes the base model and trains a small set of added weights instead. Paired with a 4-bit copy of that base, it fits most 7B and 8B fine-tunes onto a single 24 GB card. One card removes every coordination failure above, meaning the timeout, the straggler, and the memory spike on whichever rank gathers the others’ state. The tooling is in Unsloth vs Axolotl vs LLaMA-Factory and the method in What is Fine-Tuning?. A slower single-GPU run that never hangs often finishes first, because it never spends a night restarting.
⚠️ Confusion Alert: more GPUs does not mean proportionally faster training. Every rank you add buys parallel compute and pays for it in synchronization, so past a point the extra time spent syncing gradients is longer than the time the extra card saved you. Measure tokens per second for the whole job, and measure it again after every card you add.
The One Thing to Remember
You cannot debug either of the silent states after the fact. A crashed process leaves a stack trace; a hung one leaves nothing, and a thin checkpoint leaves a loss curve that looks fine. Unless you write the evidence down while the job is still running, it never exists. That is why every fix above is a decision you make before the run starts, and not a command you type once it stops.
💬 What killed your last multi-GPU run, and how long did it take you to find out?
Drop it in the comments. I read every one.
Where to Next?
📖 Go Deeper: H100 vs H200 vs B200, what actually changes when you change the card underneath the job.
🔗 Go Simpler: Why Does AI Need a GPU?, the arithmetic that makes all of the above necessary.
🔀 Related: Should You Self-Host Inference?, the serving-side version of the same own-or-rent decision.
🔜 Tuesday: What is an Eval? How you test a system that answers differently every time, and why “it looked good in the demo” is not one.
FAQ
Why does my multi-GPU training job hang with no error?
Collectives are barriers, so every rank blocks until the last one arrives. When one rank stalls or takes a different code path, the others wait silently until PyTorch’s watchdog timeout expires, which defaults to 10 minutes when NCCL is moving the bytes. The stalled rank prints nothing because nothing has failed from its point of view. Enable the flight recorder before the run to identify which rank never scheduled its collective.
What does “Watchdog caught collective operation timeout” actually mean?
A collective operation on that rank did not finish inside the group’s timeout, so PyTorch aborted the communicator and crashed the process. It means that rank was waiting, and it usually means a different rank never showed up. PyTorch’s own engineering write-up describes the rank that first raises this error as rarely the culprit, so treat the message as a starting point and read the flight recorder dump for the actual cause.
How often should I checkpoint a training job?
Make saving cheaper before you make it rarer. A synchronous 7B save blocks training for about 150 seconds, which is why teams stretch the interval and then lose hours to a crash. An asynchronous one blocks for about 6, which buys you a 15-minute cadence for almost nothing. The full arithmetic is in the checkpoint section above.
Why does only one rank run out of memory?
Memory pressure is per rank. Activation memory scales with the batch a rank receives, and variable-length data hands out unequal batches. Rank 0 carries extra load from checkpoint writing and logging. And PyTorch reuses memory blocks rather than returning them, so unusable gaps build up at a different rate on each rank. Log peak allocated memory for every rank, because the number that kills the job is the worst one and an average across ranks will never show it to you.
The Llama 3 Herd of Models, arXiv (July 2024)
Distributed communication package, PyTorch documentation (July 2026)
Flight Recorder: A New Lens for Understanding NCCL Watchdog Timeouts, PyTorch (March 2026)
Flight Recorder for Debugging Stuck Jobs, PyTorch Tutorials (July 2026)
ProcessGroupNCCL environment variables, PyTorch documentation (July 2026)
CUDA semantics, PyTorch documentation (July 2026)
Asynchronous Saving with Distributed Checkpoint, PyTorch Tutorials (July 2026)
NCCL environment variables, NVIDIA (July 2026)