

What is LLM Observability?
Your LLM is a black box. Here's how to put windows in it.

LLM observability means giving your app a black box, the same idea as an airplane’s flight recorder: something that captures every step of a request so you can replay exactly what happened when the output is wrong.
🧭 Part 9 of the RAG & Search course
TL;DR
Every flight carries a black box that records every instrument reading in case something goes wrong. Most LLM apps carry nothing.
LLM observability is that recorder for your app. It logs each step of the request, from retrieval to the final output, so when an answer is wrong you pull the tape instead of guessing.
The recorder logs the whole flight, second by second. A trace captures each step of the request as its own span, latency and tokens included, so you can find exactly which one failed.
The recorder never grades the pilot’s decisions. That takes an investigator. A trace proves what happened; scoring whether the answer was right takes a second model as judge.
Airlines don’t review one flight. They watch the fleet. Monitoring charts those scores across every request over time, the same way a fleet catches a recurring fault no single flight would show.
A recorder nobody reviews is just dead weight. Instrument every request and skip the evals, and you’ve built an expensive box that only proves the crash happened.
Normal Software Fails Loudly
When a normal web service breaks, you already know the drill. You open the logs to read what the code printed, check the metrics dashboard for error rates and latency, and pull up a trace to follow one request as it hops between services. Those three signals, logs, metrics, and traces, are the classic pillars of observability, and engineers have leaned on them for years.
A trace is the most useful of the three here. It records the path of a single request: which service it touched, how long each hop took, and where it failed. When checkout latency jumps to 800ms, the trace shows you the one database call eating 600ms of it. You fix that call, the number drops, and you move on.
This works because normal software fails in legible ways. A bad request throws an exception, a slow one shows up as a high-latency span, and a broken one returns a 500. The status code, the number the server sends back to report success (200) or failure (500), tells you the truth, so the question your tools answer is simple: did the request run?
🔗 Prerequisite: for a tour of the failure modes observability has to catch, Why AI Agents Keep Failing walks through where production agents break.
Why That Breaks the Moment You Add an LLM
Your LLM feature returns a 200 OK and a paragraph of fluent English. The status code says success, the latency looks normal, and the token count is unremarkable. The answer is wrong anyway, and nothing in that response admits it.
Air Canada’s support bot told a traveler he could book now and claim the lower bereavement fare later. The airline’s real policy allows no such thing. It refused the claim, a tribunal sided with the traveler, and Air Canada paid the difference plus fees. Every request in that conversation returned a clean 200 OK, and the dashboard never flagged the bad answer1.
An LLM breaks in four ways:
Failure hides in the content. Every layer reports success: the model API returns a 200, your app returns a 200, and the request lands in your logs as a normal call. The mistake lives in the words, and no status code describes “confidently wrong.”
The system is nondeterministic. Rerun the same request and it might pass the second time, because the model can answer one prompt differently each run. A single trace proves nothing on its own. You rerun the same input many times and watch how often it actually fails.
The work is a chain of steps. A RAG pipeline (the retrieval-augmented pattern from What is RAG?) retrieves documents, builds a prompt, and calls the model. The model may then call a tool, running a function like a database lookup. A parser turns its raw text into the structured fields your app expects. When the final answer is bad, the cause can sit in any of those steps, and the status code alone cannot tell you which one broke.
Cost is per token and easy to miss. One retry loop or one bloated prompt can multiply spend without raising a single error. The bill is where it surfaces, and it surfaces too late.
⚠️ Confusion Alert: monitoring and observability are not the same thing. Monitoring tells you a number moved, like latency or error rate. Observability lets you ask why, by recording enough detail to reconstruct any single request after the fact. A dashboard of averages is monitoring. The power to replay the exact prompt, retrieval, and response behind one bad answer is observability.
How LLM Observability Works
LLM observability answers a question the status code cannot: was the answer good, and which step decided that. It does the job in three layers stacked on top of each other.
Layer one is tracing. A trace captures one full request as a tree of steps called spans. Each span records its input and output, plus its latency and token count. Those spans mirror the steps the request already runs through, from the retrieval query to the final parse. When an answer is wrong, you open its trace and read the actual prompt the model saw.
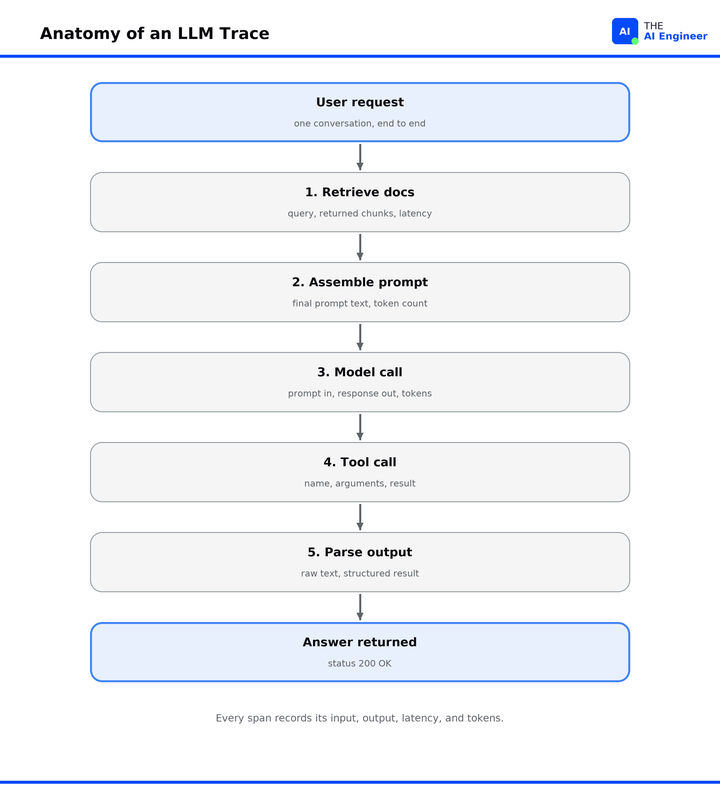
Read that trace top to bottom and a bad answer usually explains itself: the retrieval step pulled the wrong chunk, so the model never had the right fact to start with.
Layer two is evaluation, the part traditional observability never needed. A trace shows what happened. It cannot tell you whether the answer was any good, whether it fits the question, or whether the retrieved documents back it up. For that you need a score. Some scores are cheap and deterministic, like checking that the JSON parsed or that no banned word appeared. The hard ones are judgment calls: faithfulness, relevance, helpfulness. For those you use a second LLM as the judge. You hand it three things: the question, the retrieved context, and the answer. Then it rates whether the context supports the answer. The approach has real backing: in the benchmark that popularized it, a strong judge model agreed with human reviewers more than 80% of the time, about the rate at which two humans agree2.
Getting that score right is the real work, because your judge is itself an LLM and only as reliable as you make it. Three moves keep it honest:
Write a rubric. Give the judge one exact question and a fixed scale, like “is every claim supported by the retrieved text, yes or no.” Without it, the judge invents its own standard and your scores wander from run to run.
Freeze the judge. Pin it to one model and version. The judge is a model too, so if it changes underneath you, your quality scores move even when your app never did.
Correct for bias. An LLM judge favors the longer answer and the one it reads first. Score each pair in both orders and average, so position stops deciding the winner.
That score becomes the signal traditional metrics were missing. You run the judge on a sample of production traces, flag the low-scoring ones, and collect them into a dataset you replay against every future change.
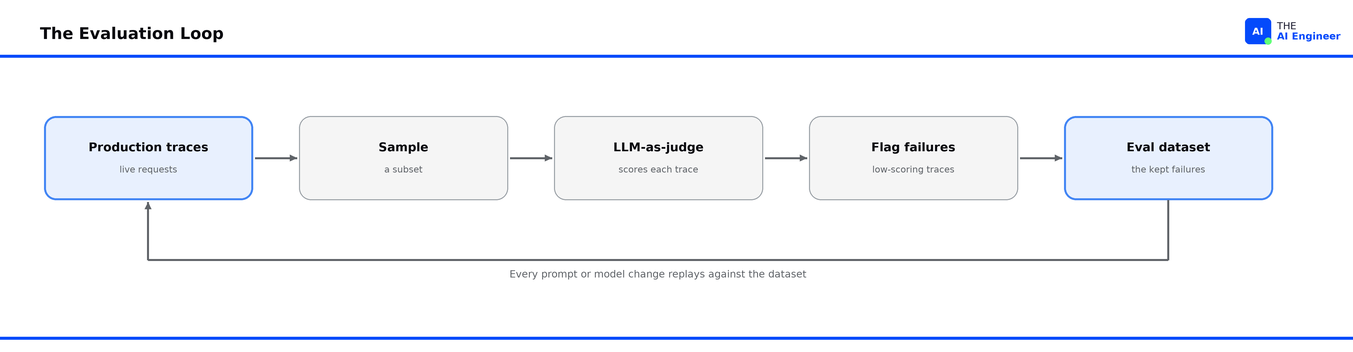
Layer three is monitoring. Tracing and evaluation look at one request at a time; monitoring watches their signals across every request over time. Once each trace carries a quality score next to its latency and cost, you can chart all three together. Quality dropping after a model upgrade, cost creeping up from longer prompts, latency spiking when a tool slows down: each becomes a line on a graph with an alert attached.
🔍 Deeper Look: there is now an open standard for what an LLM trace should contain, run by OpenTelemetry, the same project behind normal tracing. The payoff: instrument your app to it once, and you can switch observability tools later without redoing the work. OpenTelemetry’s GenAI trace conventions
Who’s Building With This
Honeycomb, an observability company, shipped Query Assistant, a feature that turns a plain-English question into a database query. Status codes could not tell them whether the generated query was any good. So they instrumented the feature: every prompt, response, and error logged, plus a yes-or-no thumb from the user. That data pinned the top failure: the model often returned text with no valid JSON. They fixed it with prompt changes, and success climbed about 15% from launch, enough to raise their internal target from 75% to 80%3.
The tooling has gone mainstream. Langfuse, an open-source platform that bundles tracing and evals, runs on your own infrastructure, so your prompts never leave your servers and you pay no per-query fee. A dozen more platforms compete beside it, and that much competition is its own signal that the category is real4.
What Can Go Wrong, and What’s Overhyped
This category is a crowded mess. Beyond Langfuse, the field includes Arize Phoenix, Helicone, Braintrust, and Weave. Datadog crosses over from traditional monitoring, and a new tool launches most weeks. The feature lists mostly rhyme. Which one you pick depends on whether you self-host, whether you need evals built in, and what your team already runs.
The trap is easy to fall into: buy a tracing tool, watch the dashboards turn green, feel covered. An agent can keep every uptime and latency chart green and still fail to do what the user asked. The dashboards are the easy half. The scores are the half that catches the wrong answer, and they take real work. Skip the evaluation half and your tracing just buys an expensive green light. The dashboard looks healthy while sitting on answers no one ever checked. The overhyped part is the one-click auto-eval: point a vendor’s judge at your app and read off a quality score. Skip the rubric for your own task, and that score is confident and wrong, the failure it exists to catch.
Two more cautions. Tracing means logging prompts and responses, which often carry user data, so capturing everything by default is a privacy problem waiting to happen. The better tools leave message content off unless you turn it on. And the eval layer has its own failure mode: an LLM judge can be wrong or biased, so teams calibrate it against human-labeled examples before they trust its scores.
The One Thing to Remember
Traditional observability answers one question: did the request run? An LLM application can pass that test on every single call and still be wrong all day long. “It ran” and “it worked” are two different questions. The status code answers only the first. LLM observability is how you answer the second.
💬 What is the worst LLM failure that slipped past your dashboards before you caught it? Reply or comment, the best war story becomes a Friday teardown.
FAQ
What is LLM observability?
LLM observability is the practice of recording every step an LLM app takes on a request and scoring whether the output was any good. It works in three layers. Tracing captures each step of a request, evaluation scores the output’s quality, and monitoring tracks those signals over time. It exists because an LLM can return a clean 200 OK and still give a wrong answer.
What is the difference between LLM observability and monitoring?
Monitoring tells you that a number changed, such as latency rising or error rate climbing. Observability lets you ask why, by recording enough detail to reconstruct any single request after it happened. For LLM apps the distinction matters, because a monitoring dashboard can show healthy latency and a 200 OK while the model returns a confident, wrong answer. Observability captures the exact prompt, retrieved context, and response, so you can replay the one conversation that failed.
What is LLM-as-a-judge?
LLM-as-a-judge is the technique of using one language model to score another model’s output. You give the judge three things: the question, the retrieved context, and the answer. It then rates whether the answer holds up. It is the standard way to grade qualities that have no simple rule. Research on the method found a strong judge model agrees with human reviewers at about the rate two humans agree with each other.
Do I need LLM observability if I already use Datadog or another APM tool?
Traditional application performance monitoring tracks whether your service is up, fast, and error-free. That tells you the request ran, but not whether the model’s answer was correct, since a wrong answer still returns a 200 OK. LLM observability adds the missing layer: capturing the full prompt and response for each call and scoring output quality. Many APM vendors now add LLM-specific tracing, so the two worlds are converging rather than competing.
How do you start with LLM observability?
Add tracing to one feature first, so every request records its retrieval step, prompt, model call, and response. Then sample those traces and score them, using simple checks where you can and a judge model for quality calls like faithfulness. Capture traces first, add evaluation second, then wire both into monitoring with alerts. Instrumenting without ever scoring quality leaves you blind to the wrong answers, which are the failures that matter most.
🔜 Friday: Zep vs Mem0 vs Letta vs Cognee, agent memory compared.
BC Tribunal Confirms Companies Remain Liable for Information Provided by AI Chatbot, ABA Business Law Today (February 2024)
Judging LLM-as-a-Judge with MT-Bench and Chatbot Arena, Zheng et al., NeurIPS (June 2023)
Improving LLMs in Production With Observability, Honeycomb (September 2023)
Disclosure, I work on an agent in this space, operatex.dev.
The tracing versus evaluation split is exactly the difference that people mess up. A green dashboard with no scoring layer just means nobody checked yet, not that anything's actually fine.
The expensive green light line is the right warning. Tracing is necessary, but it is not judgement. A trace can show the route an answer took while still leaving open whether the route was acceptable, grounded and owned. The production mistake is buying telemetry and quietly treating it as evaluation. The dashboard can be green while the semantic failure is still moving through the workflow.