


Self-hosting an LLM replaces one vendor contract with four handoffs between the parts you now run yourself. Your stack breaks at those handoffs, the model itself keeps working, and the benchmark you used to pick the engine tests none of the four.
🧭 Part 14 of the ⚡ Hardware & Inference course
TL;DR
The model is the easy part. Four handoffs around it are where things break, and none of them shows up in the benchmark you used to pick the engine.
Your API layer drops a field and says nothing. The schema accepts
response_format, the code behind it ignores it, and you get a 200 with prose in the body.Two projects drift and the backend stops loading. Triton imports vLLM modules by name, one vLLM patch release deletes one of them, and nothing serves.
Your dashboard gets 9 of vLLM’s 40-plus metrics. The two it drops are how full the KV cache is and how often a prefix gets reused, which are the two that warn you.
The engine restarts a request under you. When GPU memory runs out vLLM evicts a half-finished request and reschedules it with a shorter token list, and any state you kept outside the engine is now wrong.
🔒 Paid subscribers get
preflight.py: one file that runs all four checks against your own stack, including a real preemption, and stops your build when one of them goes unguarded. Upgrade and run it today.
The Bug That Nothing Reports
A service asks your self-hosted model for JSON. The request carries response_format, the field an OpenAI-compatible endpoint reads to force structured output. Your platform accepts it, because the schema says it is a valid field.
The model answers in prose.
Nothing raises. Nothing logs. Somewhere downstream a parser fails on prose it was never going to parse, and whoever is on call starts debugging the parser, which never saw the field your platform dropped.
Your Monitoring Tool Never Reads the Answer
So you add a test. A health check, hitting the endpoint on a timer, confirming the service answers.
It passes, and it always will, because the service does answer. It answers in prose. A health check asks whether bytes come back. A load test asks how fast they come back. Neither one opens the body and parses it, which is the whole gap: a wrong answer that arrives fast and well-formed looks identical to a right one. Only the body shows this bug: the status code says 200 in under a second, and the body carries a paragraph of English instead of the JSON you asked for.
That is the tell you are no longer debugging the model. The bug is in the handoff between two parts of your stack.
Nobody Wrote These Four Contracts Down
A hosted API is one component with one contract: tokens in, tokens out, and it can only fail the ways the vendor documents. Rate limits, timeouts, a deprecation email. We asked whether you should in Should You Self-Host Inference?. This issue is what happens after you decide yes.
Self-hosting replaces that one component with five:
A router that decides which model and which backend a request goes to,
A model manager that loads weights onto cards,
An inference engine running inside that manager, batching requests and generating the tokens,
Your dashboard, reading whatever the engine reports, and
Your own code, holding state while a request is in flight.
Four handoffs connect them, and each one is a break point:
Your caller hands a request to the router,
The manager hands it to the engine,
The engine hands numbers to your dashboard, and
The engine hands tokens back to your own code.
Nobody writes those four contracts down, agrees to them, or versions them. That is what separates a boundary from an interface: an interface has one owner, a boundary has two, and neither one is watching it. You keep all four working, and that work is what self-hosting costs.
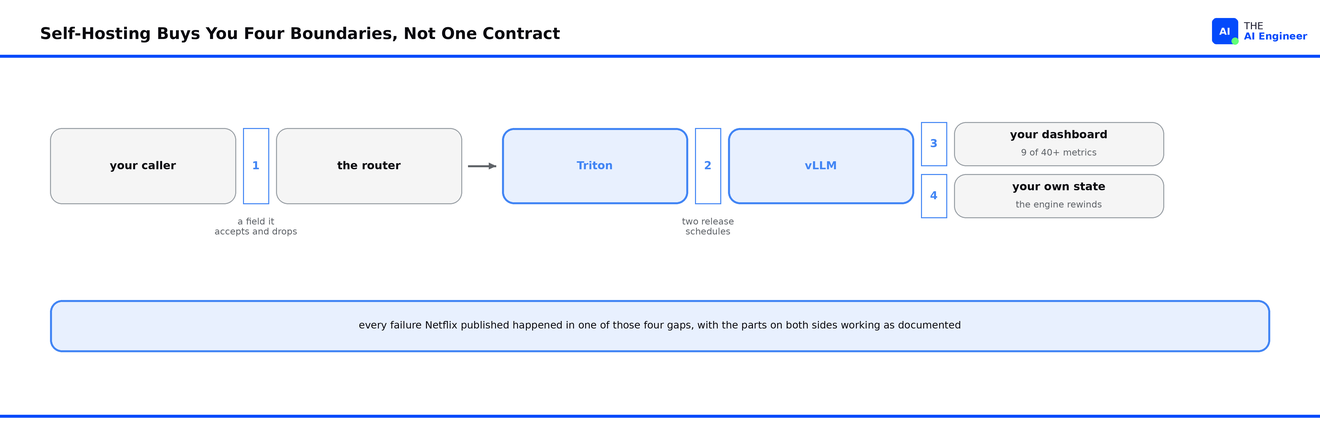
Not every stack has all four boundaries. One model serving one service runs on the engine alone, with no manager in front, so only boundaries 1 and 4 apply. Add a second model and you need that manager to load them onto shared cards, which adds boundaries 2 and 31.
Boundary 1: Your API Takes the Field and Throws It Away
You send response_format. Your schema accepts it, because it is a valid field. Then the layer behind it drops the field before the engine sees it, and you get prose with nothing holding the model to JSON and no error explaining why. You hit this the day you put your own layer in front of an engine. Take the rule with you: a field your schema accepts is a promise your schema cannot keep, because the code behind it is the only thing that decides.
A model does not emit JSON because you asked politely. At every step it produces a ranked list of possible next tokens, and something has to strike out the ones that would break your format before the engine picks one. vLLM calls that guided decoding, and it keeps one small state machine per request to do the bookkeeping: (1) inside a string, (2) expecting a comma, (3) needing a closing brace. response_format is the field that turns it on. Drop the field and the state machine never starts, so nothing strikes anything out and the model writes whatever it likes.
An OpenAI-compatible API guarantees the same request and response fields. The spec says nothing about what your layer does with a field it never implemented, so assume it drops them quietly.
The same boundary bites again on deployment, and this time the shapes break. Your packaged model declares its input and output tensors in config.pbtxt, the file Triton reads when it loads the model. Ship a config that says dims: [ 1, 512 ] and it accepts 512-token inputs and nothing else. Bump to a 1024-token variant and the config changes, which changes the request the box accepts.
You hit that on your next rollout. The cheap way is red-black: you stand the new version beside the old, shift traffic across, retire the old one. For a few minutes both serve, and your callers cannot switch config until every box has moved, so their old-shaped requests keep hitting your new boxes and failing.
The fix is one line of config. Declare the varying dimension as dynamic, [1, -1] instead of a fixed number, and every version takes an identical request. Red-black works again. Keep side-by-side versions for the changes that really do break the interface, because that one costs you more every hour it runs.
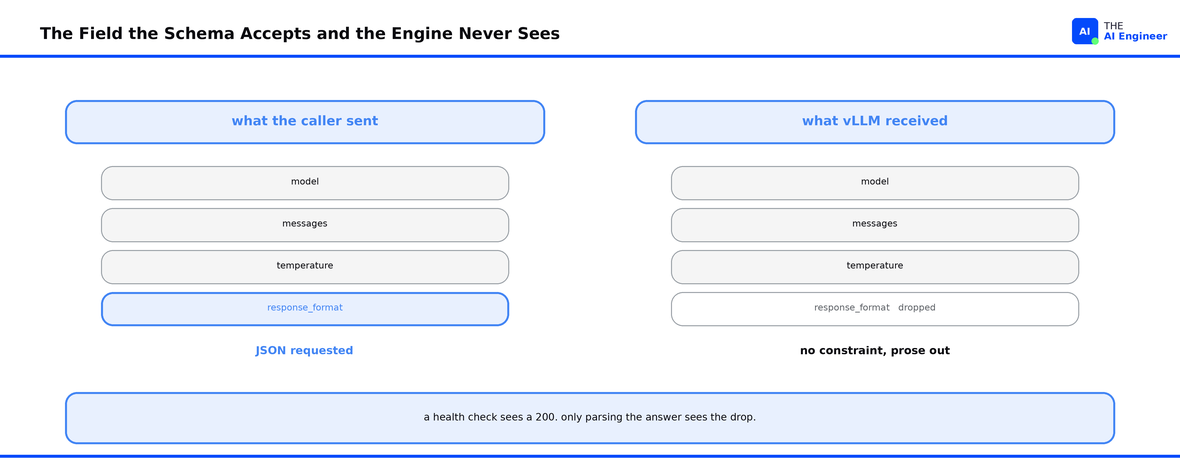
What to do: parse the body instead of trusting the status code. Send a prompt with no reason to produce JSON, ask for JSON anyway, parse the answer, and run it against every path a request can take. Run it against every path a request can take. If it fails you have two moves. (1) Map the field yourself in your own layer: fast, and yours to maintain forever. (2) Fork the HTTP layer and translate response_format into the guided decoding settings vLLM actually reads, which is the fix Netflix shipped and the one that puts you on a patch you rebase every upgrade.
Boundary 2: One Patch Release, and Nothing Serves
The manager you put in front of the engine imports the engine’s modules by name, and you now own two projects that ship on their own schedules.
Run Triton 25.09 and it imports vllm.engine.metrics when your backend loads. A vLLM patch release deletes that module. Netflix’s write-up names 0.11.2. The published wheels say 0.11.1, so 0.11.0 is the last release Triton 25.09 can load. Nothing slows down and nothing degrades. The backend fails to load entirely, at startup and inside your pipeline rather than under traffic, and that timing saves you.
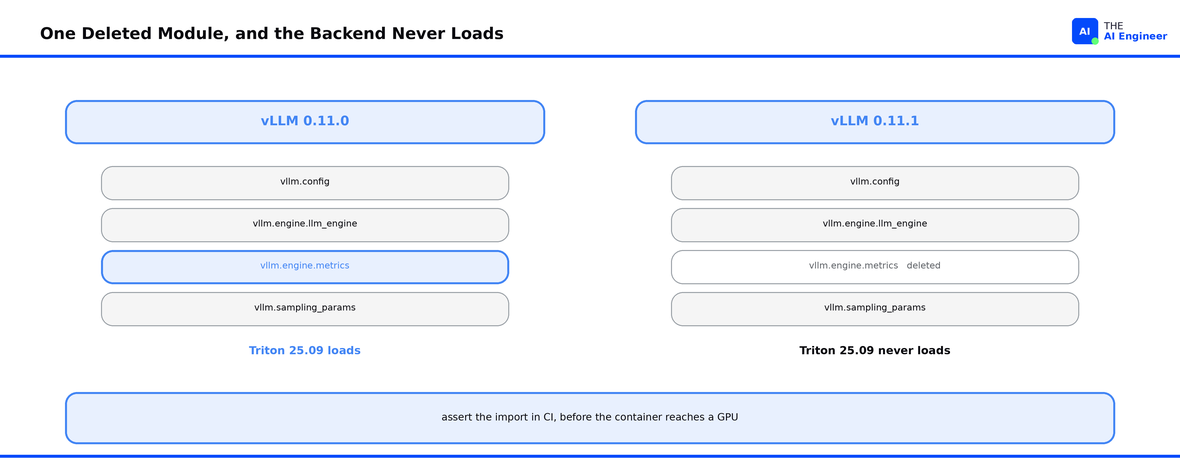
The version numbers give you no warning. A patch bump is the smallest release a project can cut, and this one takes away a module your other project imports at startup. Read it as a rule: your version risk lives in the widest gap between two release calendars, never in the size of the bump.
What to do: pin Triton and vLLM together in the serving image, and stop model authors moving either version in their own requirements. Then assert the exact import in CI, before the container reaches a GPU. Keep the assert. The next pair of releases will break on a different module.
Boundary 3: Nine Metrics Arrive, None of Them Warn You
vLLM reports more than 40 metrics on its own endpoint. Triton ships a bridge that forwards what the engine reports into your monitoring, and that bridge carries 9 of them.
The nine it forwards are not the nine you need. The write-up names three of the missing ones: (1) how many tokens a second you actually serve, (2) how full the KV cache runs, and (3) how often the engine reuses a prefix. The KV cache is the running notes a model keeps mid-conversation, one entry per token, and it is the first thing a GPU runs out of. A prefix hit is a request that opens with text the engine has already read and can skip.
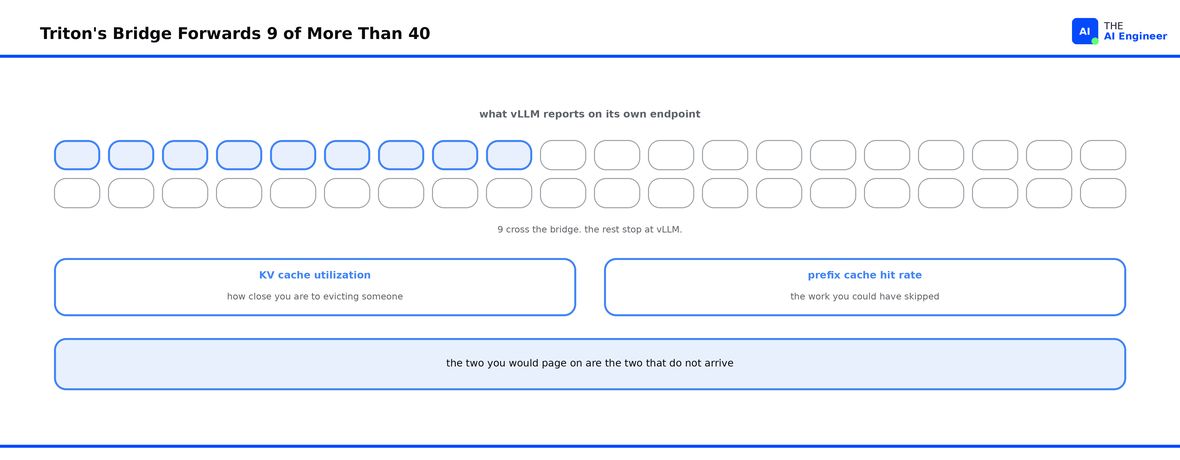
So the default dashboard tells you the service is up and the requests are arriving. It does not tell you how full the cache runs, the one number worth paging on, and you should start caring above about 90 percent sustained. When the KV cache fills, the engine evicts half-finished requests to make room. That eviction lands on your own per-request state next, at boundary 4.
What to do: get the engine’s own numbers, then alert on cache pressure specifically. Run vLLM standalone and you scrape its /metrics endpoint. Under Triton vLLM exposes no endpoint to scrape. vLLM writes its metrics to the directory named in PROMETHEUS_MULTIPROC_DIR instead, one file per worker process. You read those with prometheus_client‘s MultiProcessCollector and serve the result from a small HTTP endpoint that also proxies Triton’s own metrics, so scrapers see one surface. That endpoint runs to maybe thirty lines, and you own it from the first day you run vLLM under Triton.
Boundary 4: The Engine Rewinds, Your Code Does Not Know
This one is the least expected of the four. It hits you only when the format state machine runs in your own code instead of inside vLLM. vLLM’s V1 engine runs that state machine itself, so when it evicts and reschedules a request it rebuilds the state machine too. V1 has been the default since well before the 0.11.0 pinned above, so on any current version the format tracker belongs to the engine. Teams still run their own outside the engine, because a model that needs constraint logic vLLM does not offer leaves you no choice.
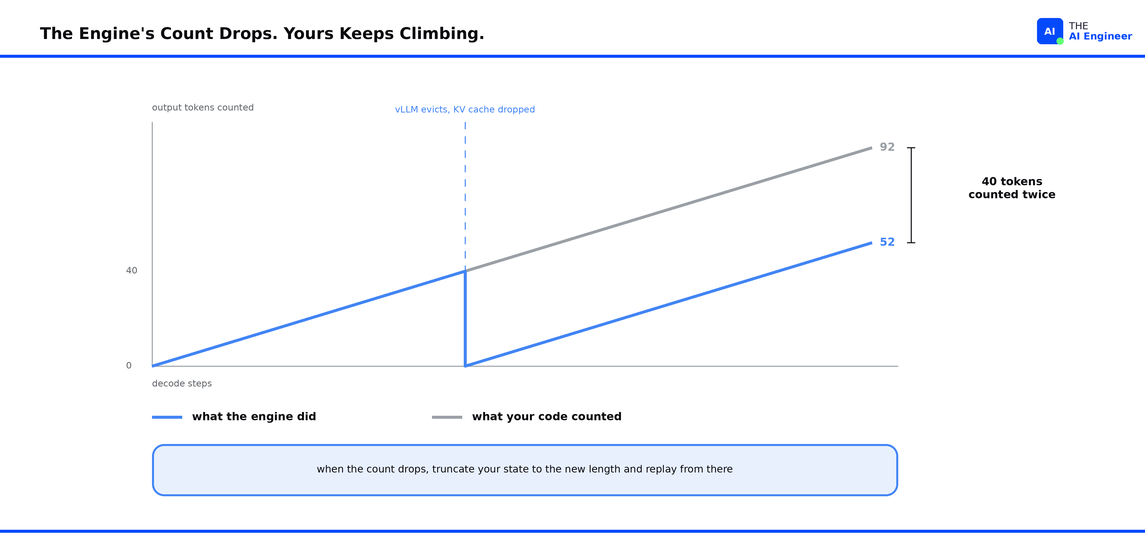
You are not in the clear, because this applies to more than the format state machine. The same rewind hits anything your code holds per request across decode steps: (1) a streaming buffer you append deltas to, (2) a token counter feeding quota or billing. When the engine rewinds, those see the regenerated tokens a second time. You fix both the same way. When the token list shrinks, truncate your state to the new length and re-apply from there instead of appending to what you already had. You see the rewind only from where your code sits. In-process against the engine’s per-step output, yes. Behind an HTTP streaming endpoint, vLLM’s frontend claims to hide the rewind. Test that it does before you rely on it.
If you constrain a model’s output to a format, something has to track where in that format the model currently is. You keep a small state machine per request doing exactly that, and it almost certainly assumes the list of output tokens only ever grows.
Under memory pressure, vLLM evicts a partially completed request, drops its KV cache, and reschedules it later. vLLM folds the tokens it already generated back into the prompt, so both the prompt and the token list arrive different from the ones your code is tracking. The list is shorter than it was one step ago, and that shrink is the only notice you get.
None of that is a vLLM bug. The engine evicts requests to survive a full GPU, and the docs say so. Your own code assumes the token list only grows. Every counter you carry across decode steps holds that assumption and none of them declare it, so no error mentions it.
What to do: detect that the token history shrank between decode steps, then throw the state machine away and rebuild it from the prompt. The general form: any state you keep outside the engine has to survive the engine restarting a request without telling you.
The One Thing to Remember
A hosted API gives you a model and one contract. Self-hosting gives you the same model and four handoffs, and you maintain every one of them.
Benchmarks miss all four because they measure inside the pieces, never between them. Tokens per second, time to first token, how busy the cards stay: every number in an engine comparison is a number about the model running. The handoffs produce no numbers at all. They produce a 200 with prose in the body, an import that fails on a Tuesday, a dashboard with a hole in it, and a state machine that drifts. You find them by integrating, and integration has no leaderboard.
Team size does not change the list. Twelve people owning the runtime full time hit the same four boundaries as one engineer owning it on top of their real job. The work does not shrink with the team, it just lands on fewer people.
The four do not arrive in the order I numbered them. Boundary 2 hits a small team first, on the first upgrade after launch, because two release schedules break it with nobody doing anything wrong. Boundary 1 waits for the first caller who depends on a field nobody tested. Boundary 4 needs memory pressure and a state machine of your own sitting outside the engine. For a first model it may never arrive. When it does, it arrives in your busiest hour. Boundary 3 causes no failure of its own. You notice the missing metrics while debugging one of the other three.
So stop evaluating engines. Every engine on your shortlist runs the model fine, and the one you pick will not be what costs you the quarter. Ask the two questions the benchmark cannot: who owns each of the four handoffs, and what tells you when one of them breaks. If the answer to the second one is a status code, you already have boundary 1 and nobody has noticed yet.
💬 What broke first when you self-hosted? Tell me in the comments.
Where to Next?
📖 Go Deeper: vLLM vs Ollama vs SGLang vs TensorRT-LLM, the engines you pick between.
🔗 Go Simpler: Why is Inference Slow and Expensive?, the constraint every serving stack works around.
🔀 Related: Why Your Multi-GPU Training Job Keeps Dying, the same failure shape on the training side.
🔜 Tuesday: Prompt Caching: The 90% Discount Most Teams Never Turn On. Where the savings actually come from, and the one config setting that most teams leave off.
FAQ
Do you need Triton at all, or can you run vLLM alone?
vLLM serves an OpenAI-compatible API by itself, so one model on one box does not need a second layer. Triton adds three things: (1) many models on shared cards, (2) a record of which version of each model is live, and (3) a router that sends each request to a model. Run one model for one service and that layer buys you nothing while adding two boundaries you would not otherwise have: (1) the version pin and (2) the metrics bridge.
Is the Triton 25.09 break still live?
No. Triton 25.10 moved the import to vLLM’s current metrics module, so that exact pair is one release old. Keep the pin anyway. Two projects with a hard dependency and separate release schedules will break on a different module later, and your assert catches it.
What about models that need custom code around them?
They cannot use the ready-made path. Three things push you onto Triton’s Python backend: (1) custom preprocessing, (2) your own tokenizer, or (3) several models chained together. There you write the exact input and output fields into the package you ship. Change those fields in the serving layer and you rebuild every one of those packages the same day.
How do you reproduce a failure that only happens when the GPU is full?
You fill the GPU on purpose. The engine evicts only when GPU memory runs out, so a staging box that never runs hot will never show you boundary 4. Size the KV cache down, hold concurrency up, and keep requests open long enough that the engine has to take memory back from something.
Is the OpenAI-compatible API the same API?
Same request and response fields. Whoever writes your layer decides the behaviour. Assume it drops every field you have not tested.
Should a small team self-host at all?
Yes, if you can name the person who checks the version pin after every upgrade. If you cannot name them today, boundary 2 hits you first.
In-House LLM Serving at Netflix, Netflix Technology Blog (July 2026)